Street network orientation of Romanian cities
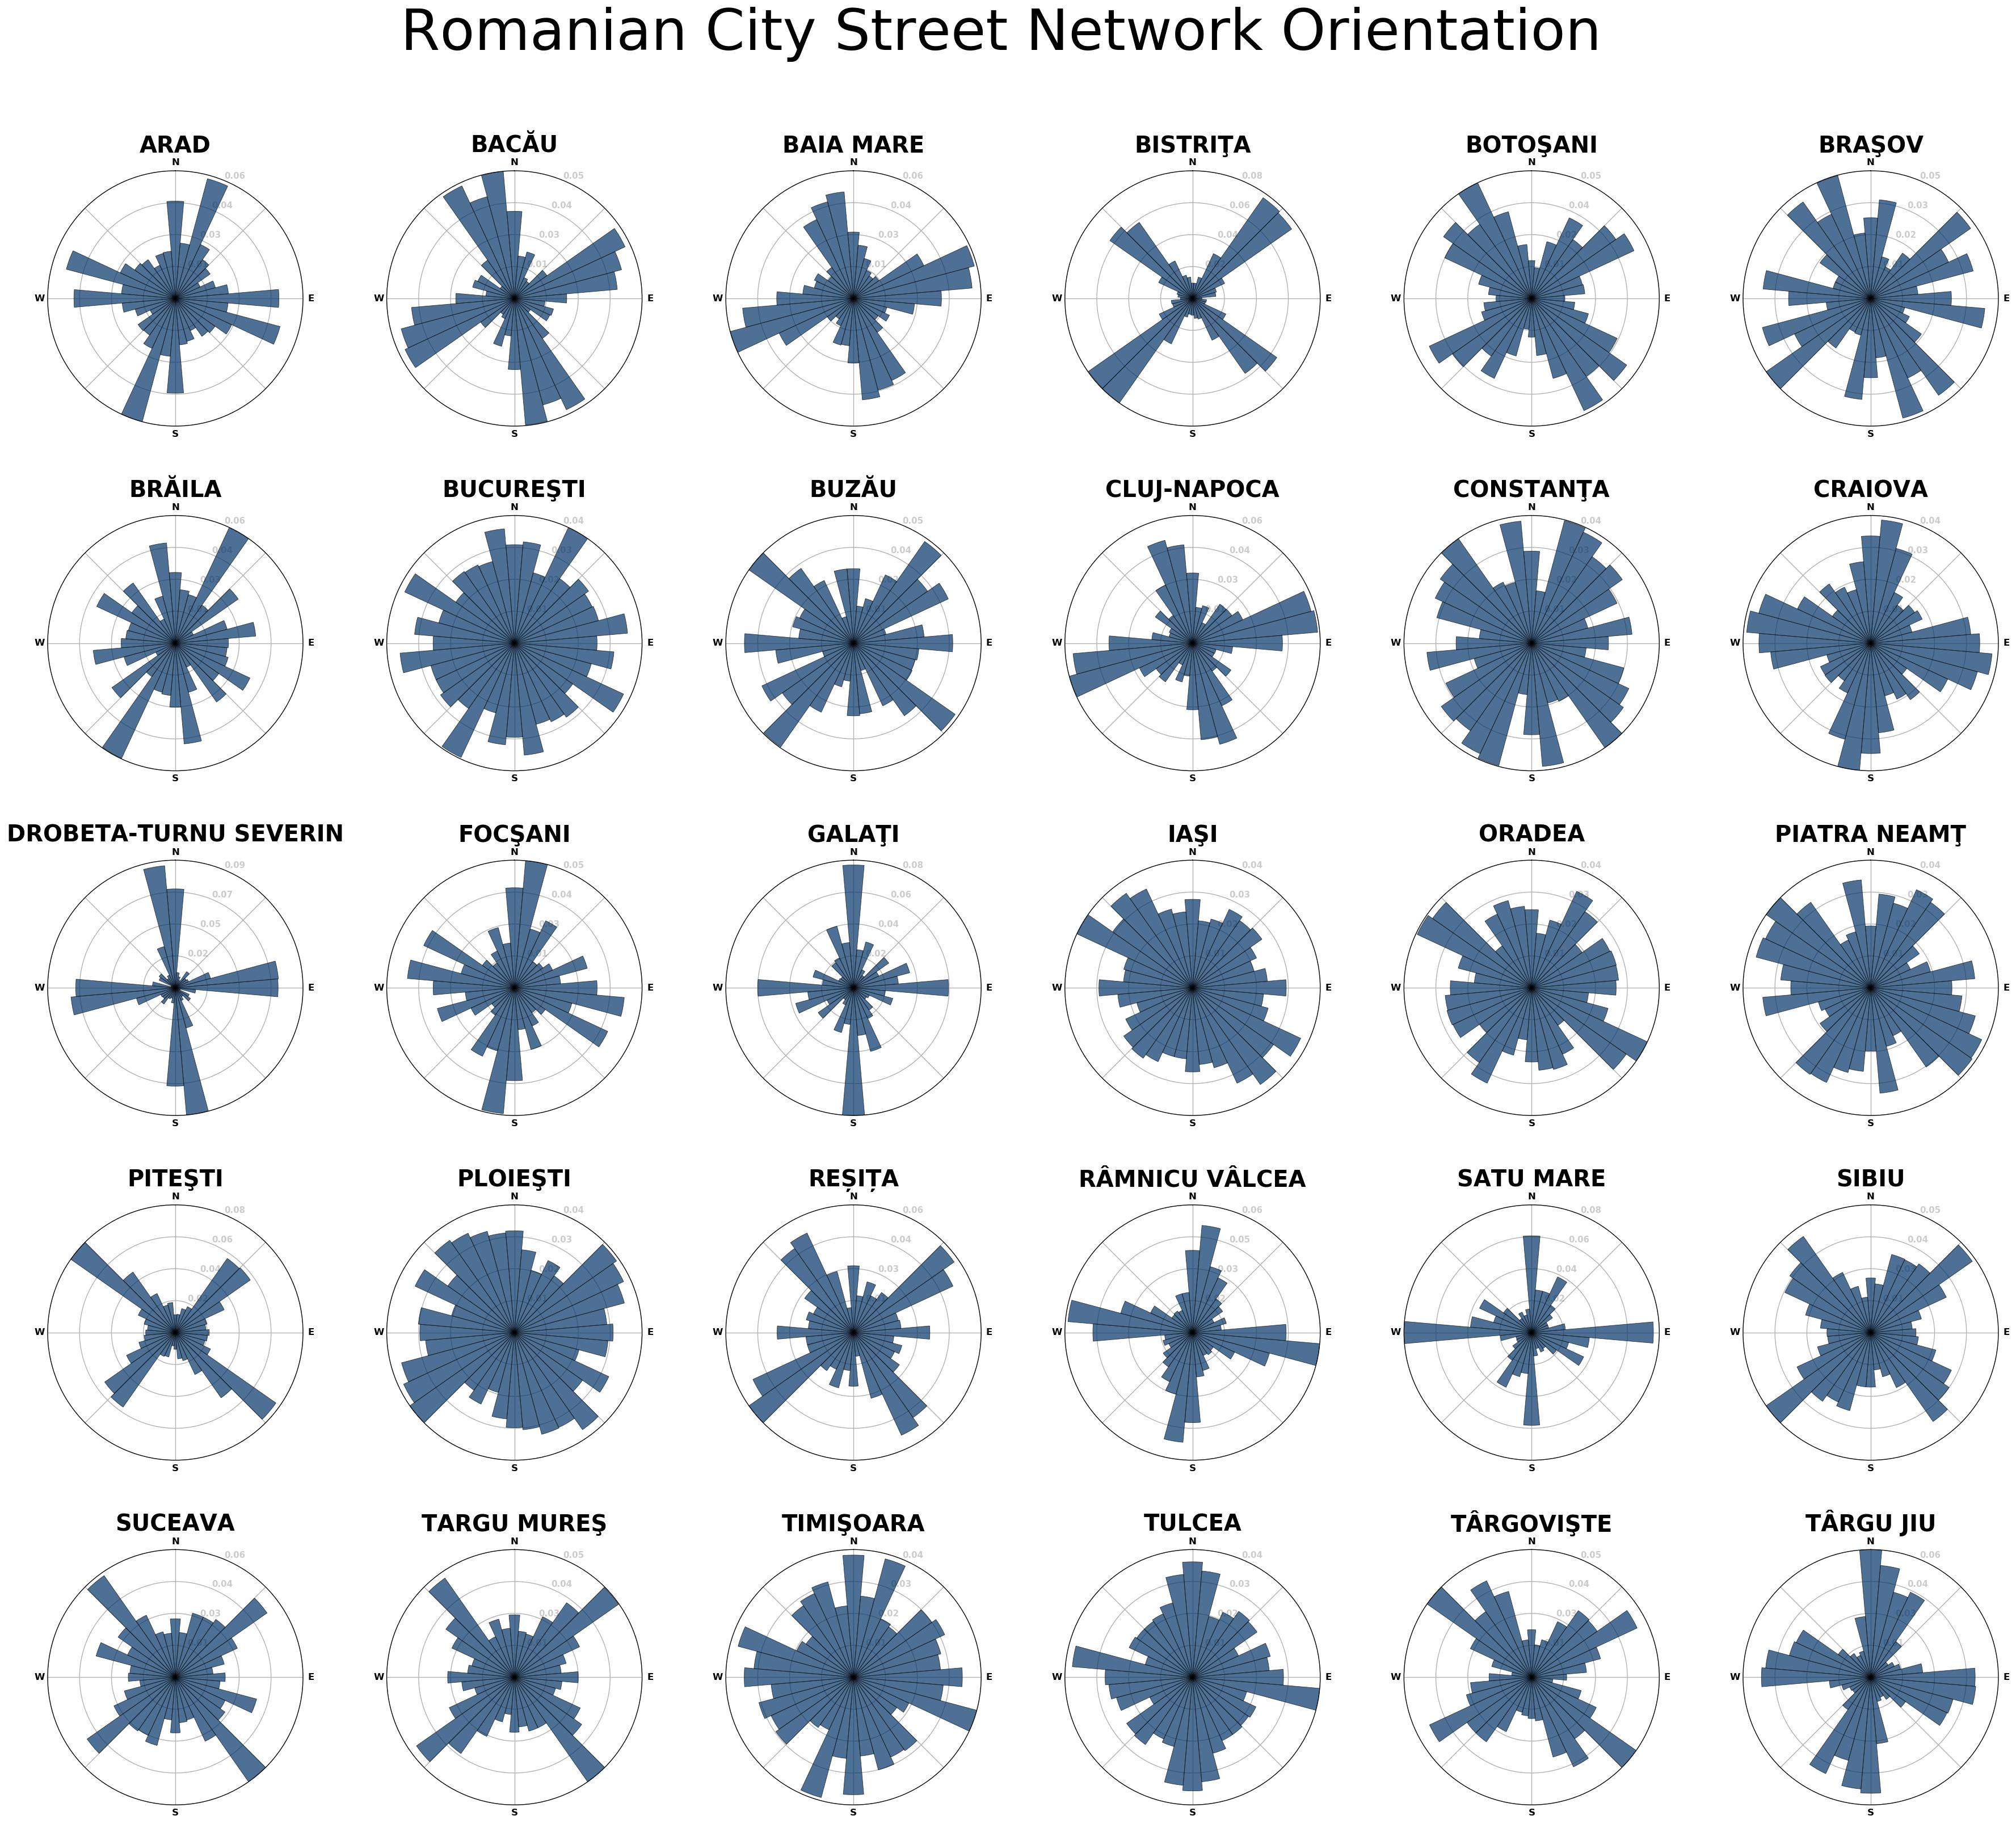
A visualization of how the street grids of Romania's major cities are laid out and oriented.
December 27, 2018,
by Tiberiu Chibici
·
Data Visualization
I kept running into these polar "street orientation" charts on data-visualization subreddits and wanted to make one for the cities closer to home. Each little rose diagram plots the compass bearings of every road in a city, so a place built on a strict grid shows up as a tidy cross, while an older town that grew more organically scatters its streets in every direction.
Here is the result for every Romanian city with a population above 75,000:
More info
I built this chart inspired by some posts on Reddit, by modifying this osmnx example. For the city list, I took all the cities having a population greater than 75k from Wikipedia.