<!-- saved from url=(0014)about:internet --> <html> <meta http-equiv="X-UA-Compatible" content="IE=9" /> <head> <title>Graphing Calculator</title> <link href="style.css" rel="stylesheet" type="text/css" /> </head> <body> <h1>Graphing Calculator</h1> <div class="section"> <h2>Content</h2> <ul> <li><a href="#plot">Plotting an expression</a></li> <li><a href="#multi">Multiple expressions</a></li> <li><a href="#nav">Navigation</a></li> </ul> </div> <div class="section"> <a name="plot"></a> <h2>Plotting an expression</h2> <p>
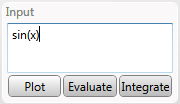
To plot an expression, simply type it in the <em>Input</em> field, and press the <em>Plot</em> button. The color of the expression is generated randomly.</p> <img src="img/plot0.png" style="margin-top: -10px;" /> </div> <div class="section"> <a name="multi"></a> <h2>Multiple expressions</h2> <p>Once you plot an expression, it will appear in the <em>Plotted expressions</em> list.</p> <img src="img/plot1.png" style="margin-top: -10px;" /> <p>
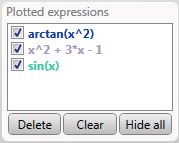
From here, you can hide and unhide expressions, delete them from the list, and empty the list using the <em>Clear</em> button.</p> </div> <div class="section"> <a name="nav"></a> <h2>Navigation</h2> <p>You can navigate using the navigation buttons from the top right corner, or the arrow keys on the keyboard. The center button resets the canvas to the original position.</p> <img src="img/plot2.png" style="margin-top: -10px;" /> <p>In the bottom right corner, you can see the zoom controls. You can also zoom using the mouse wheel, or the + and - keys.</p> <img src="img/plot3.png" style="margin-top: -10px;" /> <p>
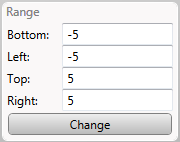
For a better control of the region you want to be drawn, you can type values (or expressions) in the <em>Range</em> area.</p> <img src="img/plot4.png" style="margin-top: -10px;" /> </div> <div class="footer"> Software created by Chibici Tiberiu. Contact: <a href="mailto:chibicitiberiu@gmail.com">chibicitiberiu@gmail.com</a> </div> </body> </html>